A Gantt chart is a horizontal bar chart that maps tasks against time. Each bar represents one task — the position shows when it starts, the length shows how long it takes. When done well, a Gantt chart gives everyone on a project a shared view of what needs to happen, in what order, and by when. (New to Gantt charts? Start with What Is a Gantt Chart? for the fundamentals.)
They are most useful when projects have multiple tasks that depend on each other, and when multiple people need to coordinate their work. A simple to-do list won't show you that Task B can't start until Task A finishes, or that two tasks are competing for the same person's time. A Gantt chart makes both of those things visible.
What You Need Before You Start
Before opening any tool, you need three things:
- A list of every task in the project — not high-level phases, but the actual work items
- An estimate of how long each task takes
- Dependencies — which tasks can't start until another finishes
Skipping any of these makes the Gantt chart look organized but be wrong. A timeline built on guessed durations is a false promise to your team and stakeholders.
Step 1: List Your Tasks
Start with a brain dump — write down everything that needs to happen to complete the project. Then organize the tasks into logical groups.
For a software product launch, that might look like:
Discovery
  - Stakeholder interviews
  - Competitor analysis
  - Requirements documentation

Design
  - Wireframes
  - UI design
  - Design review

Development
  - Backend API
  - Frontend implementation
  - Integration testing

Launch
  - QA sign-off
  - Deployment
  - Launch announcement
Keep tasks at a level where one person can own it and you can give it a realistic duration. "Build the product" is not a task. "Implement user authentication" is.
Step 2: Estimate Duration
For each task, assign a duration in days or weeks. Be honest — estimates that are too optimistic create a chain reaction of missed deadlines downstream.
A few things to keep in mind:
- Factor in review cycles. Design doesn't end when the designer finishes — it ends after stakeholder review and revisions.
- Leave buffer for tasks with external dependencies (waiting on a client, a vendor, or an approval).
- If you genuinely don't know how long something takes, that's important information. Either find out, or build buffer around it.
Step 3: Define Dependencies
Dependencies are what turn a list of tasks into a sequence. The most common type is finish-to-start: Task B can't begin until Task A is complete.
Go through your task list and mark which tasks are blocked by others. A few examples:
- UI design depends on wireframes being approved
- Development depends on design being finalized
- QA sign-off depends on development being complete
- Launch announcement depends on QA sign-off
Draw these out as a simple list before putting them in the chart — it's easier to spot logical errors in text than in a visual.
Step 4: Set Your Timeline
With tasks, durations, and dependencies in hand, you can lay out the timeline. Start from your project start date and work forward:
- Place tasks with no dependencies at the start
- For each dependent task, schedule it to start when its predecessor finishes
- Look for the critical path — the longest chain of dependent tasks that determines the earliest possible end date
The critical path is the most important thing in a Gantt chart. Any delay on the critical path delays the whole project. Tasks not on the critical path have float — they can slip a little without affecting the end date.
Step 5: Assign Owners
Every task needs one person responsible for it. Not a team, not "Dev Team" — a named person. This does two things: it makes the chart useful for resource planning (you can spot when one person is assigned to five overlapping tasks), and it makes accountability clear.
If a task doesn't have an owner, it often doesn't get done.
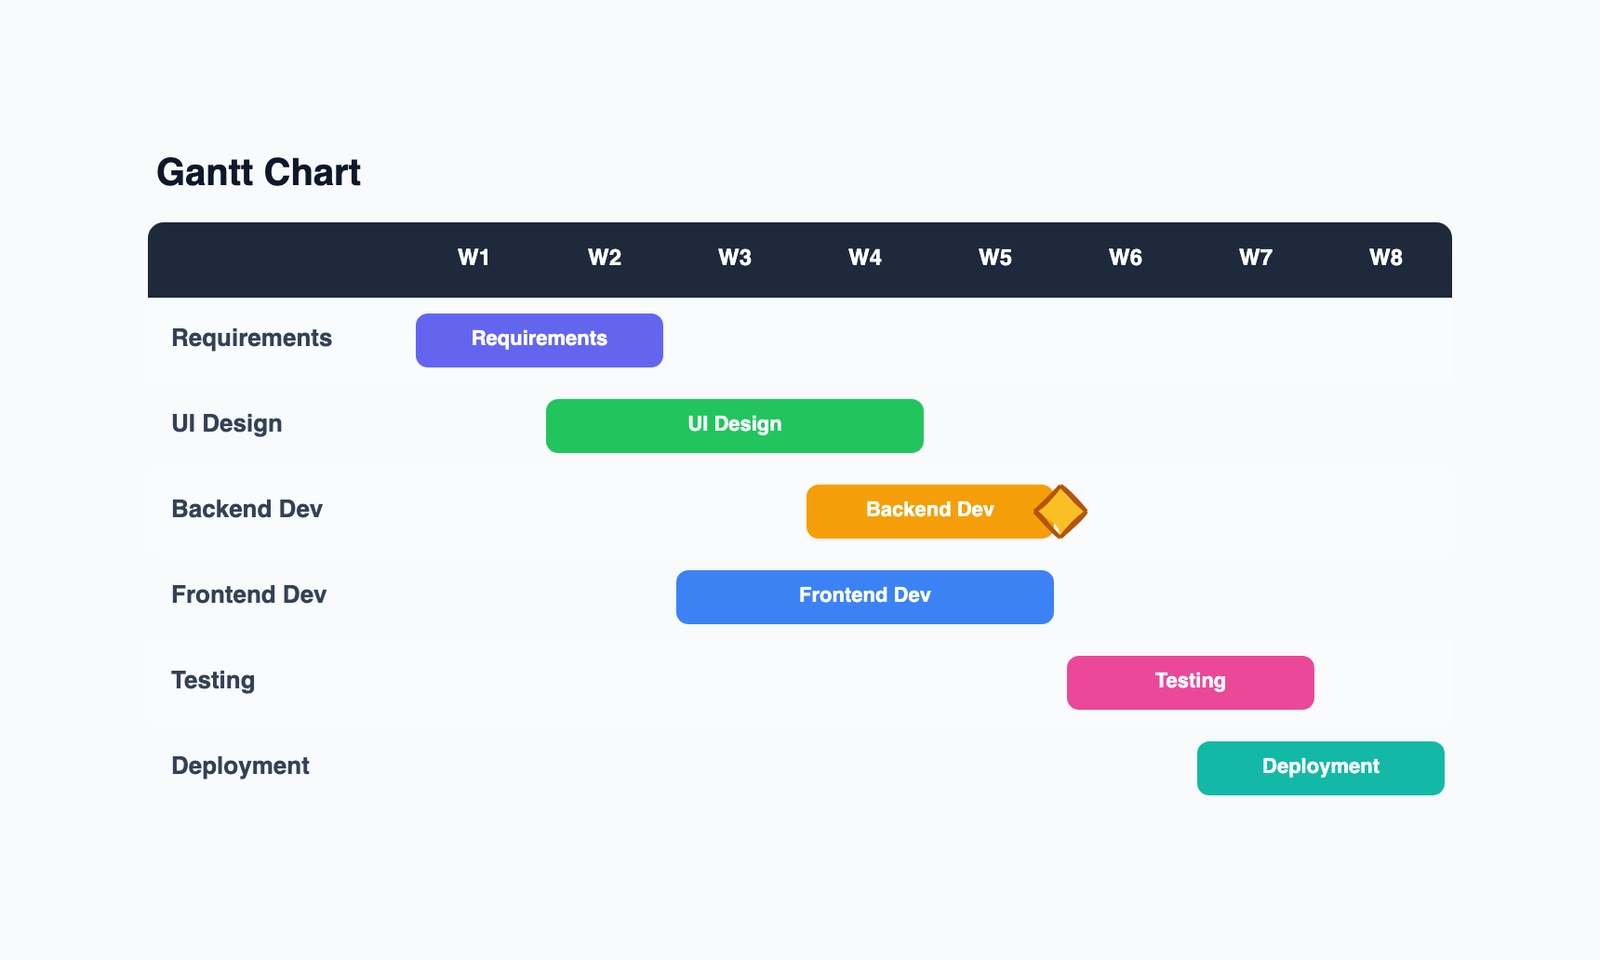
Step 6: Draw the Chart
Now you're ready to build the visual. The structure is straightforward:
- Rows: one per task (or group of tasks)
- Columns: time periods (days, weeks, or months depending on project length)
- Bars: drawn from start date to end date for each task
- Arrows: connecting dependent tasks
- Milestones: key dates marked with a diamond or marker (these are moments, not durations)
Keep the chart readable. If it has 80 rows of tasks, consider showing only phases at the top level and letting viewers drill into detail. A chart that can't be understood at a glance isn't doing its job.
Example: Website Redesign Project
Here's how a simple Gantt chart might look for a six-week website redesign:
| Task | Week 1 | Week 2 | Week 3 | Week 4 | Week 5 | Week 6 |
|---|---|---|---|---|---|---|
| Stakeholder interviews | ████ | |||||
| Content audit | ████ | ████ | ||||
| Wireframes | ████ | ████ | ||||
| Design review | ████ | |||||
| Development | ████ | ████ | ||||
| QA | ████ | |||||
| Launch | ▲ |
The critical path here runs through wireframes → design review → development → QA → launch. Any delay in that chain pushes the launch date.
Common Mistakes
Making it too detailed. A Gantt chart with 200 tasks is a spreadsheet in disguise. Keep it at a level where each row represents meaningful work, not every individual action.
Ignoring dependencies. A list of tasks with bars laid out end-to-end isn't a Gantt chart — it's a timeline. The dependencies are what make it useful for planning.
Not updating it. A Gantt chart created at the start of a project and never touched again is a historical document, not a planning tool. When reality diverges from the plan, update the chart.
Confusing milestones with tasks. A milestone is a point in time — "design approved" or "launch date." It has no duration. If you give a milestone a bar, you're treating a moment like a task.
Planning at 100% capacity. If every person is assigned tasks that fill all their available time, one sick day cascades into a missed deadline. Build in at least 20% buffer for unexpected work.
When a Gantt Chart Isn't the Right Tool
Gantt charts work well for projects with defined scope, predictable tasks, and clear dependencies. They work less well for:
- Early exploration — when you don't know what the tasks are yet, a mind map or kanban board is more useful
- Ongoing operations — a support queue or content calendar fits kanban better than Gantt
- Highly uncertain projects — if estimates will be wrong by 50%, a Gantt chart creates false precision
For agile teams running sprints, Gantt charts are often too rigid. Sprint planning and a kanban board serve the same coordination function with less overhead.
Gantt charts are most valuable when you spend the time to build them correctly — honest estimates, real dependencies, named owners. A chart built on those foundations gives your team something to navigate by. One built on wishful thinking just delays the moment when reality asserts itself.
Next Steps
Ready to create your own Gantt chart? Start with our free Gantt chart template — it includes a pre-built structure you can customize for your project. If you're evaluating tools, see our comparison of free Gantt chart makers to find one that fits your workflow.