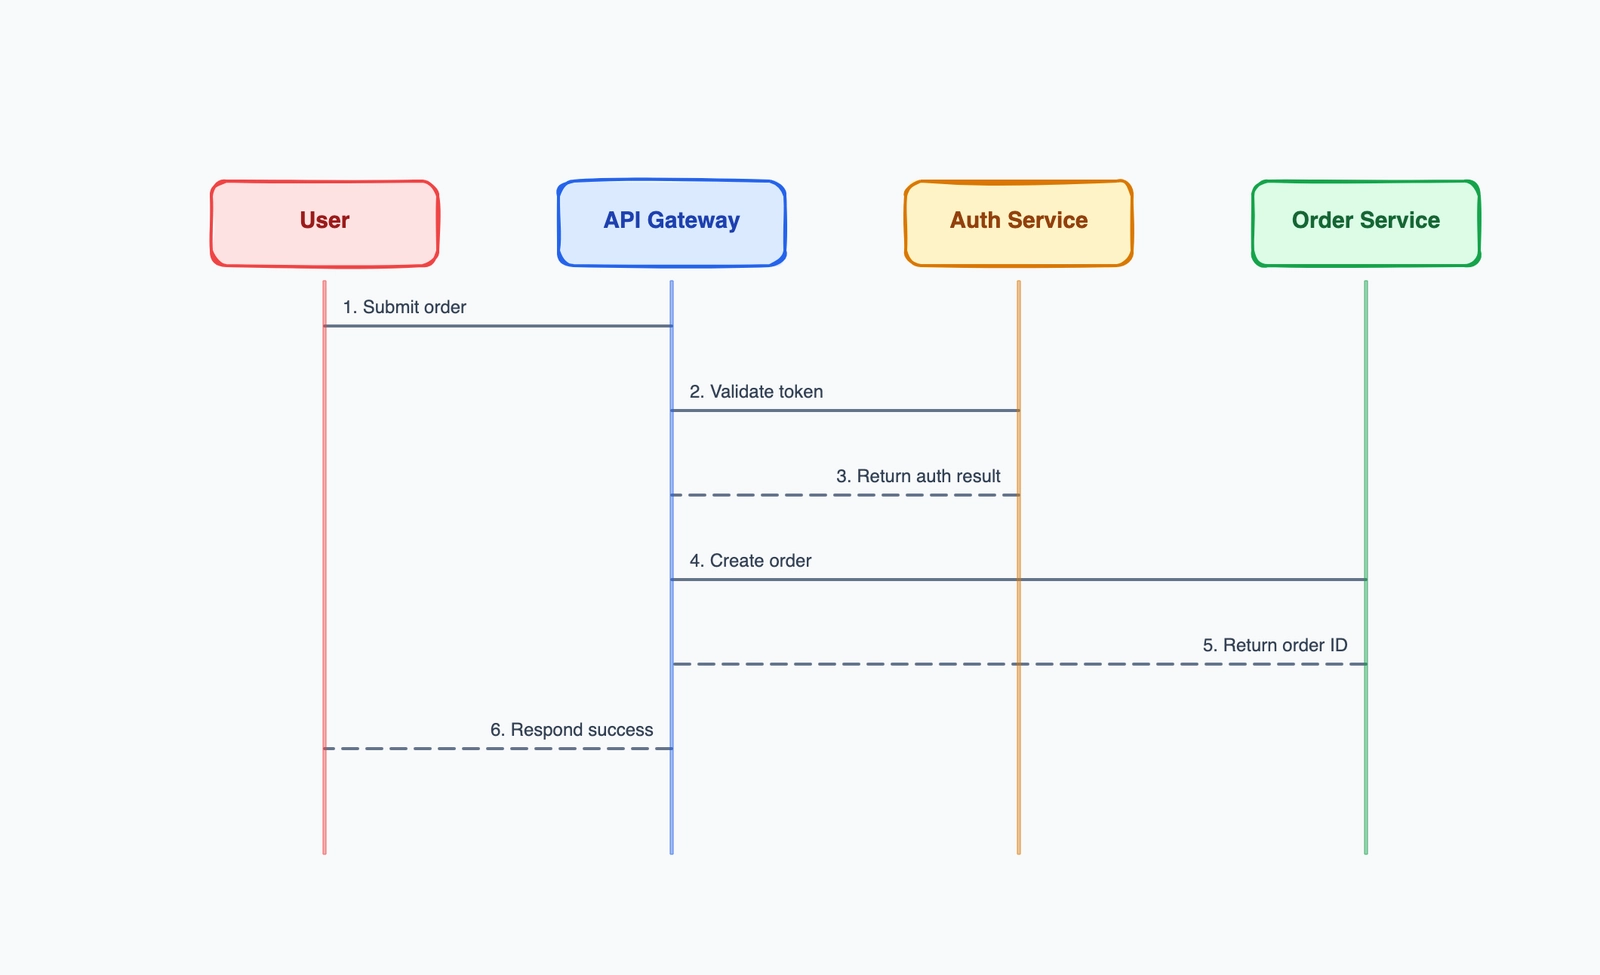
A sequence diagram shows how a set of objects, components, or systems interact with each other over time. It captures the sequence of messages passed between participants — who sends what to whom, and in what order.
Sequence diagrams are part of the UML (Unified Modeling Language) family, but you don't need to know UML to use them. The core concept is intuitive: participants are shown as columns, time flows downward, and messages are horizontal arrows connecting participants. Reading a sequence diagram is a matter of following the arrows from top to bottom.
They're most commonly used in software engineering to document how a system behaves for a specific scenario: a user login flow, a payment processing sequence, an API request-response cycle, a microservices interaction. The value is that they make implicit behavior explicit — forcing you to specify every message, every response, and every system involved.
How to Read a Sequence Diagram
A sequence diagram has five elements you need to recognize:
Participants (also called actors or objects) appear at the top as labeled boxes or stick figures. A participant can be a user, a system, a service, a database, or any entity that sends or receives messages.
Lifelines are the vertical dashed lines that extend downward from each participant. They represent the participant's existence over the duration of the interaction.
Messages are horizontal arrows between lifelines. They represent communication — a function call, an HTTP request, a database query, a user action. Each message should be labeled with what it is.
- Solid arrowhead (
—>) = synchronous message (sender waits for a response) - Open arrowhead (
-->) = asynchronous message (sender doesn't wait) - Dashed arrow (
- - >) = response / return value
Activation boxes are thin rectangles drawn on a lifeline to show when that participant is active — processing a request or waiting for a response to return.
Time flows downward. The top of the diagram is earlier; the bottom is later. Messages higher in the diagram happen before messages lower in the diagram.
Example: User Login Flow
This example shows what happens when a user submits a login form:
User        Browser          API Server        Database
 |              |                 |                |
 |  Enter creds |                 |                |
 |  Submit form |                 |                |
 |              |  POST /login    |                |
 |              |  credentials    |                |
 |              |                 |  SELECT user   |
 |              |                 |  WHERE email   |
 |              |                 |                |
 |              |                 |  Return record |
 |              |                 |                |
 |              |                 |  Verify hash   |
 |              |                 |  (internal)    |
 |              |                 |                |
 |              |  200 OK         |                |
 |              |  session token  |                |
 |              |                 |                |
 |  Redirect to |                 |                |
 |  dashboard   |                 |                |
Reading top to bottom: the user enters credentials and submits the form. The browser sends a POST request to the API. The API queries the database to find the user record, receives it, verifies the password hash internally (note: no arrow goes out for this — it's a local computation), and returns a 200 OK with a session token. The browser then redirects the user to the dashboard.
A few things the diagram reveals that prose wouldn't:
- The browser doesn't talk to the database directly — everything goes through the API
- Password verification happens in the API, not the database
- The database returns the full user record, not just a boolean "password matches"
More Examples
Payment Processing
Customer    Frontend    API Server    Payment Gateway    Database
    |           |            |               |               |
    |  Submit   |            |               |               |
    |  payment  |            |               |               |
    |           | POST /pay  |               |               |
    |           |            | Charge card   |               |
    |           |            |               |  Process      |
    |           |            |               |  transaction  |
    |           |            |  Approval     |               |
    |           |            |  code         |               |
    |           |            |               |               |
    |           |            | INSERT order  |               |
    |           |            |               |   Order saved |
    |           |  Confirm   |               |               |
    |           |  page      |               |               |
    | Receipt   |            |               |               |
    | email     |            |               |               |
This diagram reveals the sequence dependency: the charge must succeed before the order is saved. If the charge fails, no database write happens.
Microservices: Order Notification
OrderService    EventBus    NotificationService    EmailProvider
     |              |               |                    |
     | Order        |               |                    |
     | confirmed    |               |                    |
     | Publish      |               |                    |
     | order.placed |               |                    |
     |              |  Subscribe:   |                    |
     |              |  order.placed |                    |
     |              |               | GET user email     |
     |              |               |  (from UserSvc)    |
     |              |               |                    |
     |              |               | Send email via     |
     |              |               | provider           |
     |              |               |                    |
     |              |               |    Delivery receipt|
The diagram makes the asynchronous nature explicit: OrderService publishes and forgets. It has no idea if or when the email goes out. NotificationService handles that independently.
API Call with Error Handling
Client          API           Cache         Database
  |              |               |               |
  | GET /item/42 |               |               |
  |              | Cache lookup  |               |
  |              |               | Cache MISS    |
  |              |               |               |
  |              | DB query      |               |
  |              |               |               DB: Item found
  |              | Store in cache|               |
  |              |               | Stored        |
  |              |               |               |
  | 200 + item   |               |               |
  |              |               |               |
  | GET /item/99 |               |               |
  |              | Cache lookup  |               |
  |              |               | Cache MISS    |
  |              | DB query      |               |
  |              |               |               DB: Not found
  | 404 Not Found|               |               |
This diagram documents both the happy path (item found) and the error path (item not found), and shows the caching layer's behavior in both cases.
Sequence Diagram Notation Reference
| Notation | Meaning |
|---|---|
Solid arrow —> | Synchronous message or call |
Dashed arrow --> | Return / response |
Open arrowhead - -> | Asynchronous message |
| Activation box (rectangle on lifeline) | Participant is processing |
[condition] in square brackets | Guard — only happens if condition is true |
loop [n times] box | Repeated sequence |
alt [condition] box | Alternative paths (like if/else) |
opt [condition] box | Optional sequence |
par box | Parallel sequences |
ref box | Reference to another diagram |
The alt, opt, and loop boxes are called combined fragments — they allow you to show conditional and repeated behavior without drawing separate diagrams for each branch.
Sequence Diagrams vs. Other UML Diagrams
| Diagram | Shows | Best For |
|---|---|---|
| Sequence | Message order between participants | Documenting specific flows |
| Class | Static structure, relationships | Data model design |
| State machine | State transitions | Objects with complex state |
| Activity | Process flow | Business processes, algorithms |
| Component | System architecture | High-level architecture |
| Use case | User goals | Requirements gathering |
Sequence diagrams are the right choice when the question is "what happens when X does Y, in what order?" They're less appropriate for questions about static structure, state management, or high-level architecture.
When to Draw Sequence Diagrams
Before implementing a new feature. Draw the sequence before writing code. The act of drawing forces you to think through every message and discover edge cases, missing error paths, or unclear service responsibilities.
When designing an API. A sequence diagram makes the request-response contract concrete and reviewable before any code is written.
When debugging distributed system failures. When a multi-service interaction fails in production, mapping the expected message sequence and comparing it to traces often reveals where the breakdown occurs.
For developer onboarding. A sequence diagram of the most important flows in your system gives new engineers context they'd otherwise spend weeks piecing together from reading code.
When aligning on service responsibilities. When there's ambiguity about which service should do what, a sequence diagram surfaces the question explicitly: where does this arrow belong?
When Not to Use Sequence Diagrams
For high-level architecture overviews. If you want to show which services exist and how they're connected in general, a component diagram is clearer. A sequence diagram for a system with 20 services would be unreadable.
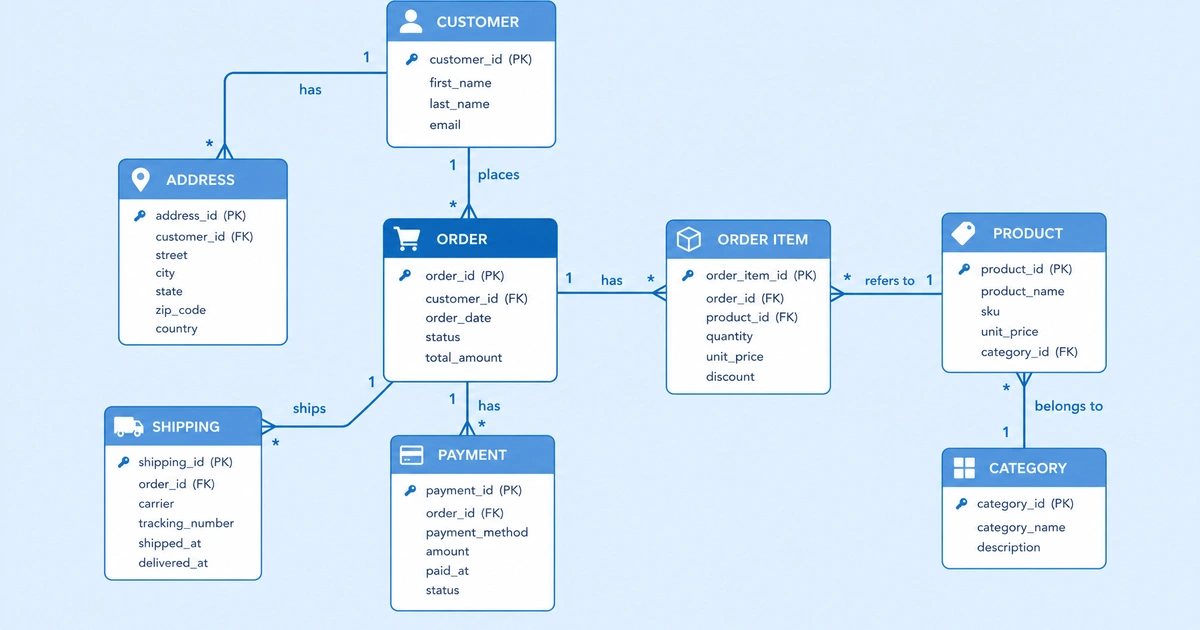
For static relationships. If you want to show how database tables relate to each other, use an ERD, not a sequence diagram.
For every possible scenario. A sequence diagram should document one specific, well-defined scenario. Don't try to show all possible paths in a single diagram — use alt blocks for important branches, but keep it focused.
Frequently Asked Questions
How detailed should a sequence diagram be? Include every participant that meaningfully affects the behavior being documented. Leave out infrastructure concerns (load balancers, logging) unless they're the focus. If the diagram has more than 6-7 participants, consider splitting it into sub-diagrams.
Should I include error paths? Yes, for any production-relevant errors. Missing error paths in sequence diagrams are a common source of bugs — the diagram documents the happy path but doesn't specify what happens when the database is down or the external API returns an error.
What's the difference between a sequence diagram and a flowchart? A flowchart shows steps in a single process with decision branches. A sequence diagram shows messages between multiple distinct participants. Flowcharts answer "what happens next?" — sequence diagrams answer "who does what, and in what order?"
Do sequence diagrams have to use UML notation exactly? Not for practical use. Many teams use a simplified version — just boxes for participants, lines for messages, and labels. The UML notation adds precision for complex scenarios (combined fragments, activation boxes) but isn't necessary for basic documentation.
Next Steps
Ready to create your own sequence diagram? Check out our step-by-step guide to drawing sequence diagrams or start directly with our sequence diagram template.