If you write technical docs, you know the drill: you draw an architecture diagram, then paste a block of code next to it to explain what a module actually does. The diagram and the code live in separate places, so readers bounce back and forth. Worse is when people use screenshots — low resolution, no copy-paste, and you have to re-capture the whole thing every time one line changes.
What if you could put the code right inside the diagram? Not a screenshot — a real code block, with syntax highlighting, editable, laid out alongside your other shapes.
CodePic's new Code element does exactly that. This article covers how to use it and where it fits best.
When You Need Code Inside a Diagram
Here are the most common cases.
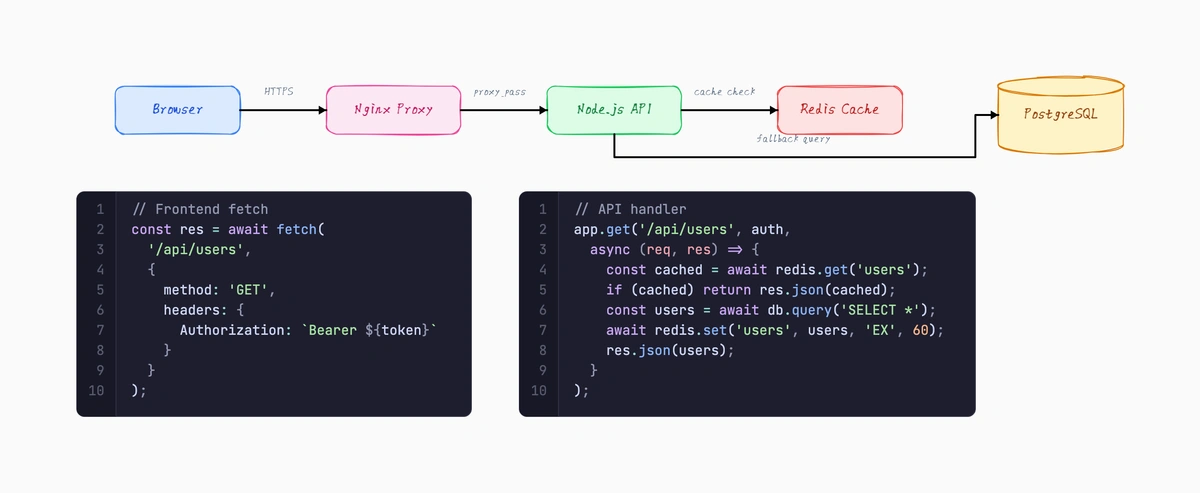
API design docs. You draw a request flow: client sends a request to a gateway, the gateway routes to a service, the service queries a database. Everyone can draw that. But what does the request body look like? What's the response format? If you can drop a JSON code block next to the gateway, it's clear at a glance — no need to dig through another document.
Deployment and ops runbooks. CI/CD pipelines constantly need config snippets — Docker Compose, Nginx config, Kubernetes YAML. These configs are short but critical, and placing them next to the matching node in a flow diagram is far more useful than burying them at the end of a doc.
Code review and tech sharing. When you want to walk a teammate through the call chain of a piece of code, sketch a simple flow and embed the key function snippets right in it. Clearer than a plain screenshot, and the other person can actually read the code structure.
Data processing pipelines. Data flows from system A to system B, passing through cleaning, transformation, and aggregation. Annotating each step with a small snippet of SQL or Python is far more precise than a text label like "group and aggregate field X."
How to Use the Code Element
Add it to the canvas
Open the CodePic editor, find Code in the shape panel on the left, and click or drag it onto the canvas. By default it creates a dark code block with two lines of sample code.
Edit the code
Double-click the Code element to enter edit mode. You'll see a syntax-highlighted editor where you can type code directly. Tab indentation works, and the editing experience is close to a regular code editor. Press Escape or click an empty area to exit.
Pick a language
With the Code element selected, switch languages in the Inspector on the right or the code settings in the floating toolbar. Over 20 languages are supported:
Bash, C, C++, CSS, Dockerfile, Go, HTML, Java, JavaScript, JSON, JSX, Kotlin, Markdown, PHP, Python, Ruby, Rust, SQL, Swift, TSX, TypeScript, YAML.
Syntax highlighting updates instantly when you switch. CodePic remembers your last choice and uses it automatically next time you create a Code element.
Dark and light themes
The Code element supports two themes: Dark and Light. The dark theme uses the Catppuccin Mocha palette; the light theme uses GitHub Light. Switch with one click in the Inspector. Here's how both themes and the multi-language support look:
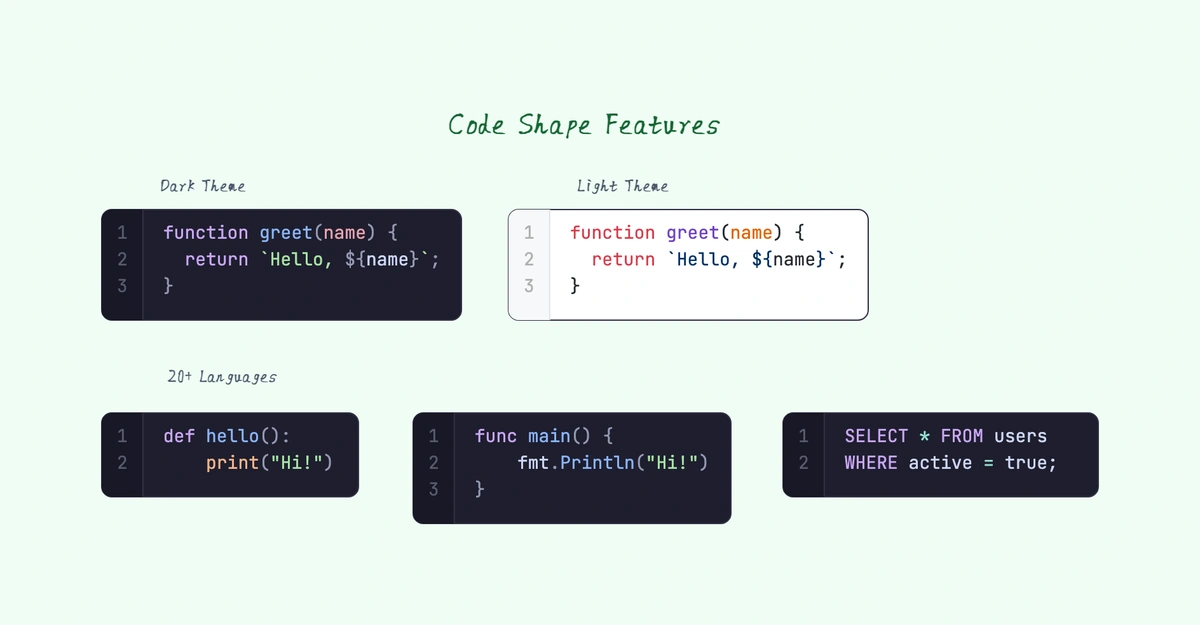
If your diagram has a light background, a dark code block gives stronger contrast — and vice versa.
Line numbers and tab width
Line numbers show by default and can be turned off in settings. Tab width supports 2, 4, or 8, defaulting to 4.
Word wrap
This setting controls how the Code element sizes itself:
-
Word wrap off (default): code doesn't wrap, and the element's width and height auto-fit the content. However long your code is, that's how wide the element gets. Best when your lines are short.
-
Word wrap on: code wraps at the element boundary by word, you control the width manually, and the height auto-fits the wrapped content. Best when you need a fixed width.
There's a handy shortcut: if you manually drag to resize the Code element, it automatically switches to word-wrap mode — because resizing means you want to control the width, and that's when wrapping makes sense.
Walkthrough: Drawing an API Request Flow
Here's a concrete example. Say you want to draw a user-login API flow and let readers see the request and response formats at a glance.
-
Draw three rectangles: "Client," "API Gateway," and "User Service," connected with arrows.
-
Place a Code element next to "Client," set the language to JSON, and enter the request body:
{
  "email": "user@example.com",
  "password": "********"
}
- Place another Code element next to "User Service" with the response:
{
  "token": "eyJhbGciOiJIUzI1NiJ9...",
  "user": {
    "id": "u_abc123",
    "email": "user@example.com"
  }
}
- Connect the code blocks to their matching modules with connectors.
The result is a single diagram that shows both the flow and the data formats — no jumping between the diagram and a separate doc.
How It Compares
Screenshotting code. A common approach is to screenshot code in your IDE and insert it as an image. The problems are obvious: poor resolution, not editable, re-capture for every change. The Code element is editable text — change it anytime, with syntax highlighting built in.
Mermaid / PlantUML. These are great for flowcharts and sequence diagrams, but their code-block support is limited. You can't embed a Python snippet with syntax highlighting inside a Mermaid diagram. The Code element is a standalone element on the canvas, composing freely with rectangles, connectors, and everything else.
Plain text labels. Writing "calls /api/login" inside a shape is fine, but when you want to show a full request body or a key piece of logic, a text label falls short. Code blocks are made for this kind of structured content.
Summary
The Code element solves a very specific problem: technical diagrams often need to include code, but traditional drawing tools don't support it.
Now you can mix code blocks with flowcharts and architecture diagrams in CodePic. Syntax highlighting, line numbers, theme switching, word wrap — it's all there. Just open the CodePic editor and try it.